Resolves to the first year where the chart in this page indicates that share of US energy consumption by source for solar is at or above 5%. Note that this has only updated after some months into the following year, so it may take time to resolve.

 1,000
1,000 3.00
3.00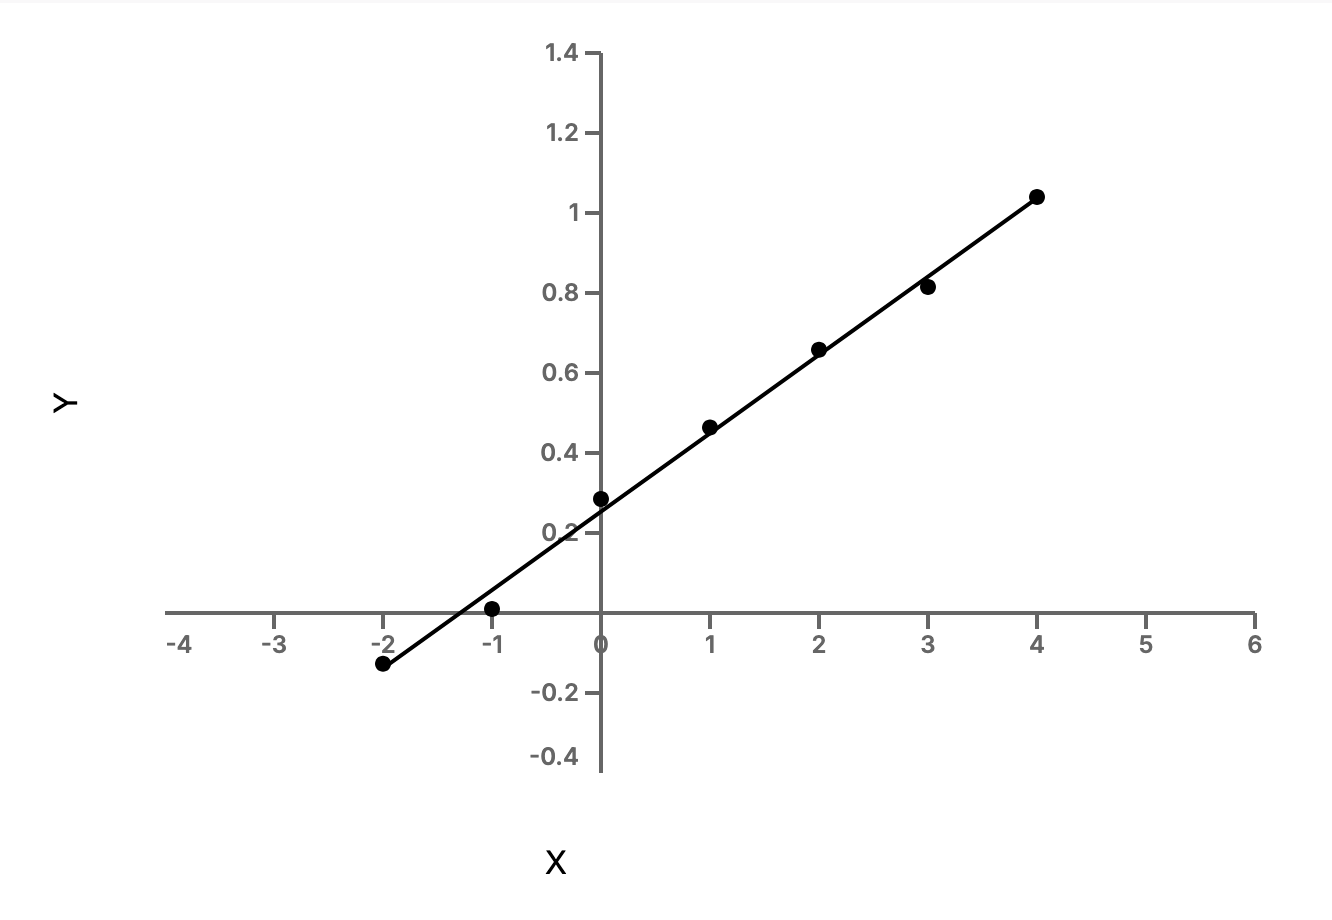
a quick linear regression (NOTE: X-axis is years-2020; Y-axis is log of percent) reveals that the trend is very, very close to an exponential, in particular very roughly Y = 0.2534 + 0.1959*X. (seriously; R^2 = 0.9959 and you don't get data this good very often.) So if Y ~ ln(5) = 1.609 then X should be about 6.9, in other words the first year should be 2027 or thereabouts.
Solar was 2.83% in 2024 so needs to double (accounts for growth in total)
Total solar capacity in 2024 was about 200 GW, with 50 GW in new installations in 2024.
I think we have fast growth in new capacity through 2027, followed by temporary stagnation or decline, due to the accelerated end of tax credits in OBB. So could take 3-4 years?